For website administrators and developers, staying vigilant about potential errors on a website is crucial to ensure a seamless user experience. One powerful tool at your disposal is cPanel's File Manager, which allows you to navigate through your website's files and directories. In this guide, we'll explore how to use cPanel's File Manager to check for site errors in the "error_log" file, helping you identify and resolve issues promptly.
Accessing cPanel's File Manager:
- Log in to your cPanel account using your credentials.
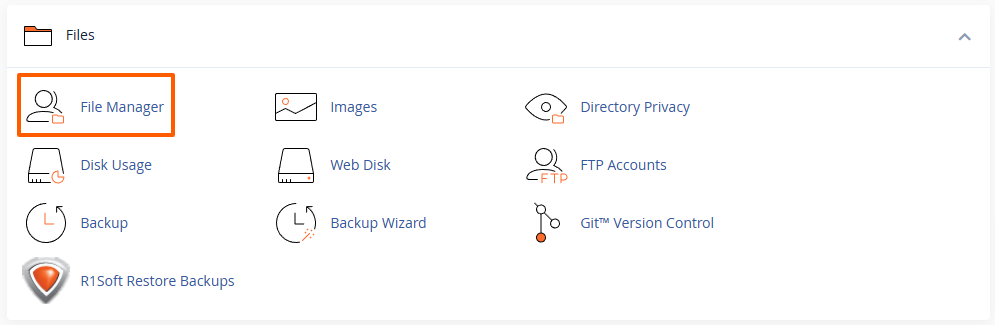
Accessing your hosting control panel (cPanel) - Navigate to the "Files" section and click on "File Manager":
Locating the "error_log" File:
-
Once in the File Manager, you'll typically find your website files in the
public_htmldirectory. Click on it to access your site's root folder. -
Look for the
error_logfile. This file contains a log of errors and issues that occurred on your website and click on the "View" or "Edit" button to see its content in a new tab: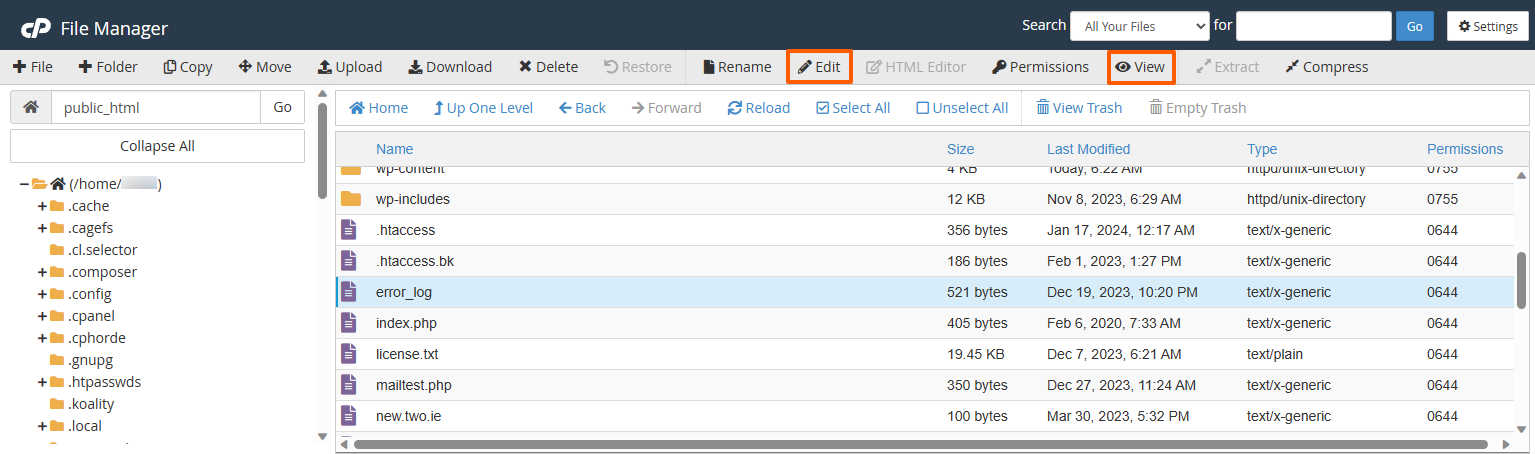
Please note: If the file is too large (2 MB or larger), we highly recommend downloading it to your computer and then opening it with any text editor (e.g. Notepad or Notepad++). Trying to open large files within the File Manager can cause your browser to become non-responsive. - The
error_logfile should look similar to this: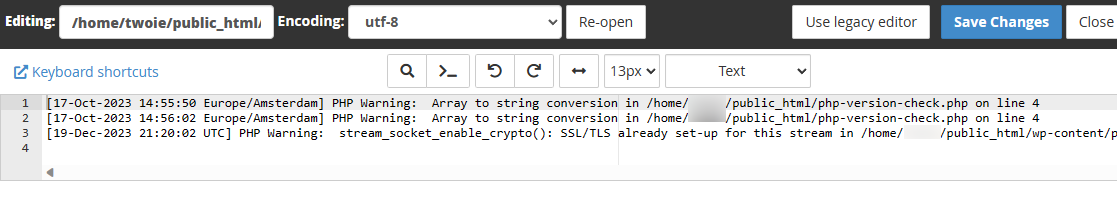
The file contains a chronological record of errors, warnings, and other relevant information. Each entry includes a timestamp, error type, and a description of the issue. -
If you can't find the
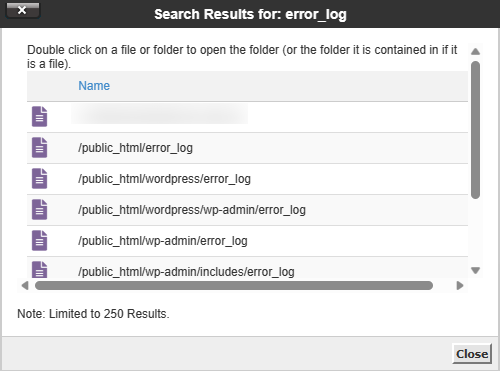
error_logfile in thepublic_htmldirectory, then errors may have been caused by scripts in other sub-directories. Please use the search function in File Manager to locate error_log files: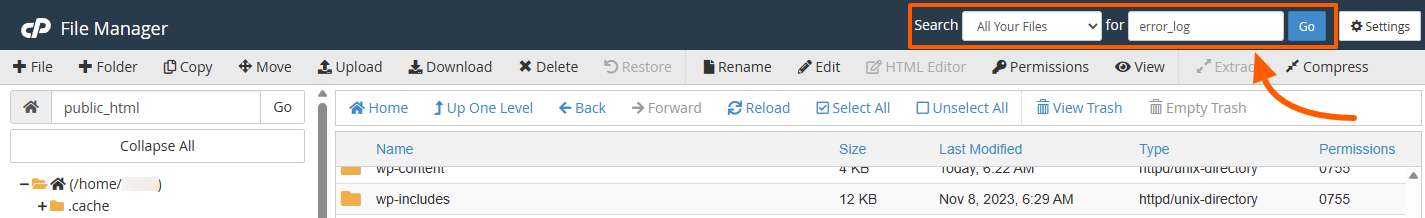
- If other error_log files exist in sub-directories, these will be shown in the search results:
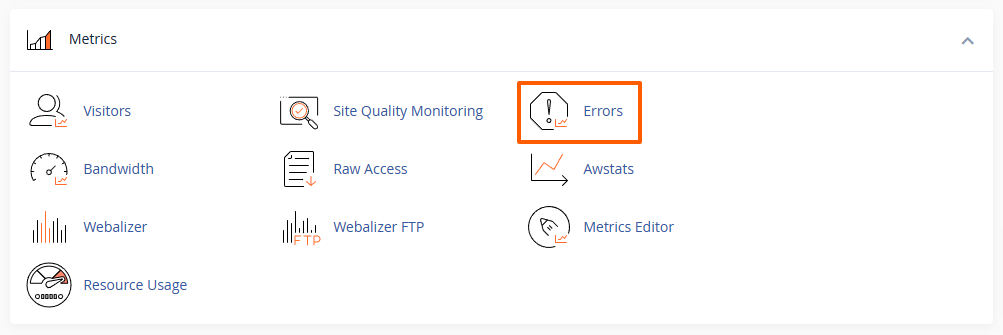
Web Server Errors
The error_log files mentioned above contain only errors related to PHP and the website. Some errors may occur at the web server level. These errors can be found in cPanel on the "Errors" page under the "Metrics" section:
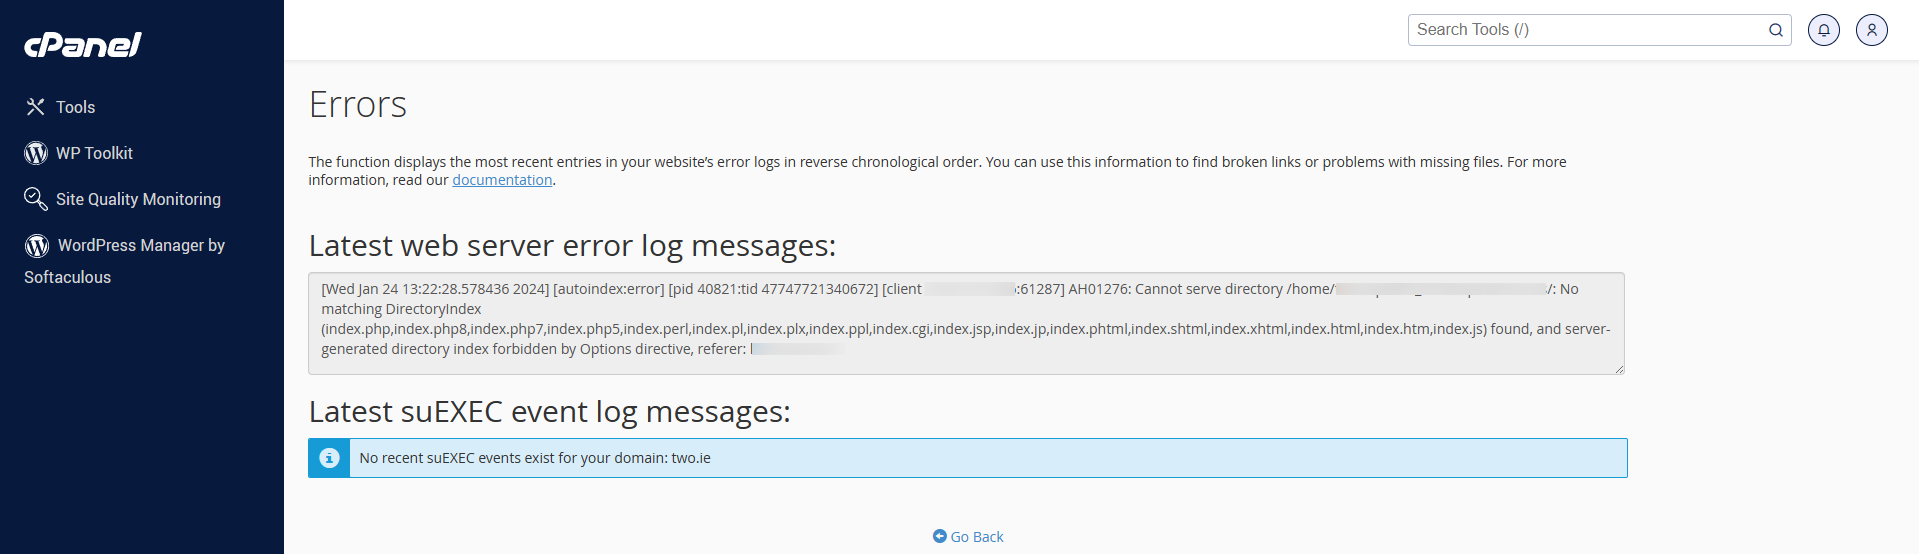
On this page you will find 300 of the most recent log entries in the web server's error logs and suEXEC logs, in reverse chronological order:
Interpreting Error Log Entries:
-
Look for entries marked with terms like "Error", "Warning" or "Fatal Error." These are indicators of issues that need attention.
-
Pay attention to the specific error messages, as they often provide clues about the nature of the problem. Common errors include PHP syntax errors, database connection issues, and file permission problems.
-
Use the timestamp to identify when each error occurred. This can be helpful in diagnosing issues related to specific events or changes on your website.
Resolving Issues:
-
Once you've identified an error, use the information provided in the log to address the root cause. This may involve fixing code errors, adjusting file permissions, or troubleshooting database connections.
-
If the error is related to a specific plugin or theme, consider disabling or updating it to resolve compatibility issues.
-
Regularly check the error log for new entries, especially after making changes to your website, to ensure that any issues are promptly addressed.
-
Forward this article and/or the error_log files to your developer for further review.
Using cPanel's File Manager to check the "error_log" file is a valuable practice for website administrators and developers to troubleshoot site-related issues. By regularly monitoring this log, you can identify and resolve issues efficiently, ensuring a smooth and error-free experience for your website visitors. Stay proactive, address errors promptly, and enjoy a more reliable and optimised website.
Updated by SP on 24/01/2024


